Draw graph for Linux sar output using ksar
September 8, 2021 1 Comment
I’ve recently heard about this tool , as it is said we are learning things until the death (:
Our company is saving sar output in a text file periodicly and after performance or other issues we need to analyze it’s output to find out which resource was busy and when.. analyzing text file is time-consuming and can also cause eye tension.
Output in sar:
00:00:01        CPU      %usr     %nice      %sys   %iowait    %steal      %irq     %soft    %guest    %gnice     %idle
00:10:01        all      3.14      0.00      2.43      1.64      0.00      0.00      0.60      0.00      0.00     92.20
00:10:01          0      3.64      0.00      2.33      4.10      0.00      0.00      1.10      0.00      0.00     88.83

00:00:01      scall/s badcall/s  packet/s     udp/s     tcp/s     hit/s    miss/s   sread/s  swrite/s saccess/s sgetatt/s
00:10:01         0.00      0.00      0.00      0.00      0.00      0.00      0.00      0.00      0.00      0.00      0.00

...
00:00:01       totsck    tcpsck    udpsck    rawsck   ip-frag    tcp-tw
00:10:01         5682       656      1783         0         6       502
00:20:01         5651       668      1748         0         0       804
CPU, Network, Disk I/O, etc. activities are logged.
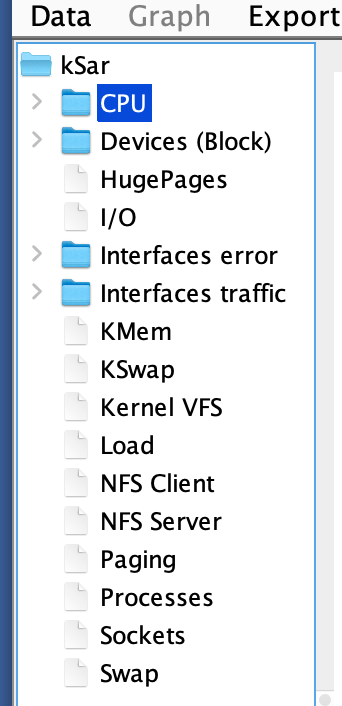
Same text file analyzed by ksar tool and graphycally displayed is the following:

Full list of items that can be seen graphycally are the following:
Now I will show all necessary information that is necessary to use this tool:
1. Download a pre-built jar from GitHub releases page.
2. Run jar on your computer:
java -jar ksar-5.2.4-b396_gf0680721-SNAPSHOT-all.jar
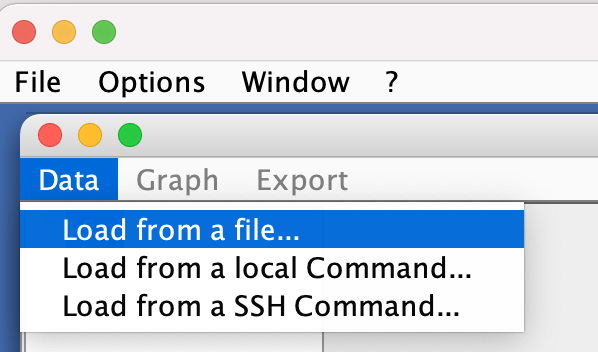
3. Click Data -> Load from a file…and choose output of sar in a text file
Full information about this tool: https://github.com/vlsi/ksar
