Monitoring ASM disk performance using IOSTAT

iostat in asmcmd displays I/O statistics for Oracle ASM disks in mounted disk groups.

Connect to the database node via GI owner:

# su - grid

Run iostat with the following options (Reads & Writes are in bytes):

# asmcmd
ASMCMD> iostat -t -G FRA 5
Group_Name  Dsk_Name   Reads      Writes    Read_Time  Write_Time
FRA         RAC1$LUN3  585083392  98942464  94.659862  4.03044
FRA         RAC2$LUN3  1847296    98942464  .054822    4.134049
FRA         RACQ$LUN4  57344      24576     .035944    .018594

Group_Name  Dsk_Name   Reads      Writes  Read_Time  Write_Time
FRA         RAC1$LUN3  368640.00  0.00    0.01       0.00
FRA         RAC2$LUN3  0.00       0.00    0.00       0.00
FRA         RACQ$LUN4  0.00       0.00    0.00       0.00

Where
-t displays time statistics (Read_Time, Write_Time)
-G FRA displays statistics for the FRA diskgroup, change the diskgroup name according to your needs.
5 is a refresh interval. When the interval is specified then the value displayed (bytes or I/Os) is the difference between the previous and current values, not the total value. But if a refresh interval is not specified, the number displayed represents the total number of bytes or I/Os.

For synopsis and description about all available iostat options, run help:

ASMCMD> help iostat
iostat
        Displays I/O statistics for Oracle ASM disks in mounted disk groups.

Synopsis
        iostat [-et][--io] [--suppressheader] [--region] [-G <diskgroup>] [<interval>]

Description
        iostat lists disk group statistics using the V$ASM_DISK_STAT view.
        The options for the iostat command are described below.
        -e		- Displays error statistics (Read_Err, Write_Err).
        -G diskgroup	- Displays statistics for the disk group name.
        --suppressheader	- Suppresses column headings.
        --io		- Displays information in number of I/Os, instead
                          of bytes.
        -t		- Displays time statistics (Read_Time, Write_Time).
        --region	- Displays information for cold and hot disk regions
                          (Cold_Reads, Cold_Writes, Hot_Reads, Hot_Writes).
        interval	- Refreshes the statistics display based on the
                          interval value (seconds).
        The attribute descriptions for iostat command output are described
	below. To view the complete set of statistics for a disk group,
	use the V$ASM_DISK_STAT view.
        Group_Name	        Name of the disk group.
        Dsk_Name	        Name of the disk.
        Reads	        	Total number of bytes read from the disk.
				If the --io option is entered, then the value
				is displayed as number of I/Os.
        Writes	        	Total number of bytes written to the disk.
				If the --io option is entered, then the value
				is displayed as number of I/Os.
        Cold_Reads	        Total number of bytes read from the cold disk
				region. If the --io option is entered, then
				the value is displayed as number of I/Os.
        Writes	        	Total number of bytes written to the disk.
        Cold_Writes	        Total number of bytes written to the cold
				disk region. If the --io option is entered,
				then the value is displayed as number of I/Os.
        Hot_Reads	        Total number of bytes read from the hot
				disk region. If the --io option is entered,
				then the value is displayed as number of I/Os.
        Writes	        	Total number of bytes written to the disk.
        Cold_Writes	        Total number of bytes written to the cold
        Hot_Writes	        Total number of bytes written to the hot disk
				region. If the --io option is entered, then the
				value is displayed as number of I/Os.
        Read_Err	        Total number of failed I/O read requests for
				the disk.
        Write_Err	        Total number of failed I/O write requests for
				the disk.
        Read_Time	        Total I/O time (in seconds) for
				read requests for the disk if the
				TIMED_STATISTICS initialization parameter is
				set to TRUE (0 if set to FALSE).
        Write_Time	        Total I/O time (in seconds) for
				write requests for the disk if the
				TIMED_STATISTICS initialization parameter is
				set to TRUE (0 if set to FALSE).
        Writes	        	Total number of bytes written to the disk.
        Cold_Writes	        Total number of bytes written to the cold
        Hot_Writes	        Total number of bytes written to the hot disk
        If a refresh interval is not specified, the number displayed represents
        the total number of bytes or I/Os.  Ifa refresh interval is specified,
        then the value displayed (bytes or I/Os) is the difference between the
        previous and current values, not the total value.

Examples
        The following are examples of the iostat command. The first example
        displays disk I/O statistics for the data disk group in total number
        of bytes. The second example displays disk I/O statistics for the data
        disk group in total number of I/O operations.
        ASMCMD [+] > iostat -G data
        Group_Name  Dsk_Name   Reads       Writes
        DATA        DATA_0000  180488192   473707520
        DATA        DATA_0001  1089585152  469538816
        DATA        DATA_0002  191648256   489570304
        DATA        DATA_0003  175724032   424845824
        DATA        DATA_0004  183421952   781429248
        DATA        DATA_0005  1102540800  855269888
        DATA        DATA_0006  171290624   447662592
        DATA        DATA_0007  172281856   361337344
        DATA        DATA_0008  173225472   390840320
        DATA        DATA_0009  288497152   838680576
        DATA        DATA_0010  196657152   375764480
        DATA        DATA_0011  436420096   356003840
        ASMCMD [+] > iostat --io -G data
        Group_Name  Dsk_Name   Reads  Writes
        DATA        DATA_0000  2801   34918
        DATA        DATA_0001  58301  35700
        DATA        DATA_0002  3320   36345
        DATA        DATA_0003  2816   10629
        DATA        DATA_0004  2883   34850
        DATA        DATA_0005  59306  38097
        DATA        DATA_0006  2151   10129
        DATA        DATA_0007  2686   10376
        DATA        DATA_0008  2105   8955
        DATA        DATA_0009  9121   36713
        DATA        DATA_0010  3557   8596
        DATA        DATA_0011  17458  9269
Advertisement

Draw graph for Linux sar output using ksar

I’ve recently heard about this tool , as it is said we are learning things until the death (:

Our company is saving sar output in a text file periodicly and after performance or other issues we need to analyze it’s output to find out which resource was busy and when.. analyzing text file is time-consuming and can also cause eye tension.

Output in sar:

00:00:01        CPU      %usr     %nice      %sys   %iowait    %steal      %irq     %soft    %guest    %gnice     %idle
00:10:01        all      3.14      0.00      2.43      1.64      0.00      0.00      0.60      0.00      0.00     92.20
00:10:01          0      3.64      0.00      2.33      4.10      0.00      0.00      1.10      0.00      0.00     88.83

00:00:01      scall/s badcall/s  packet/s     udp/s     tcp/s     hit/s    miss/s   sread/s  swrite/s saccess/s sgetatt/s
00:10:01         0.00      0.00      0.00      0.00      0.00      0.00      0.00      0.00      0.00      0.00      0.00

...
00:00:01       totsck    tcpsck    udpsck    rawsck   ip-frag    tcp-tw
00:10:01         5682       656      1783         0         6       502
00:20:01         5651       668      1748         0         0       804

CPU, Network, Disk I/O, etc. activities are logged.

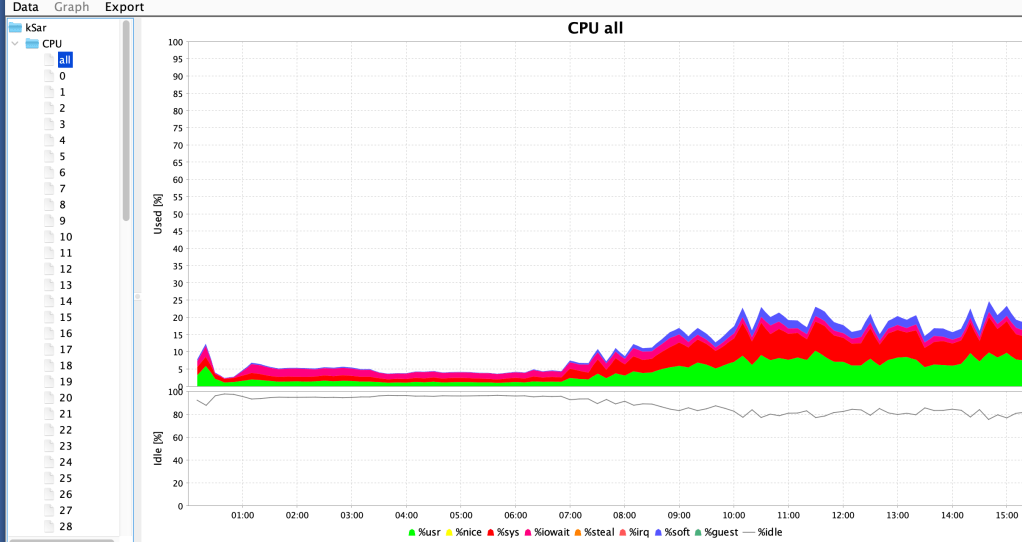
Same text file analyzed by ksar tool and graphycally displayed is the following:

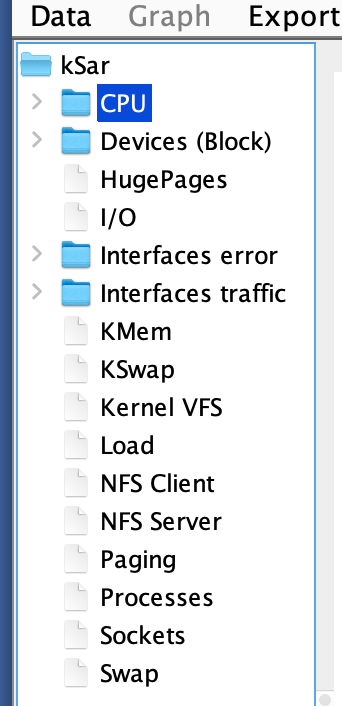
Full list of items that can be seen graphycally are the following:

Now I will show all necessary information that is necessary to use this tool:

1. Download a pre-built jar from GitHub releases page.

2. Run jar on your computer:

   java -jar ksar-5.2.4-b396_gf0680721-SNAPSHOT-all.jar

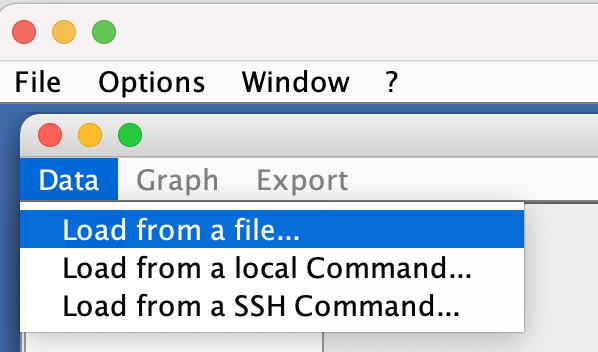
3. Click Data -> Load from a file…and choose output of sar in a text file

Full information about this tool: https://github.com/vlsi/ksar

Exadata Performance Diagnostics with AWR

” The contents of this paper apply to all Exadata deployments – whether onpremises, Public Cloud, or Cloud at Customer “

Click to access exadata-awr-5100655.pdf

Table Locks and Foreign Keys

Brief Description:

After reading “Expert Indexing in Oracle Database 11g ” book, I decided to share the following information with you. Which, I think, is very very useful.

It is better to index foreign key columns to avoid locking issues. Note, that locking issues are avoided when index type is B-tree, not Bitmap.

The Scenario:

Note: This is the quote from the following book:

Expert Indexing in Oracle Database 11g
Maximum Performance for Your Database

Darl Kuhn
Sam R. Alapati
Bill Padfield

“Here’s a simple example that demonstrates the locking issue when foreign key columns are not indexed.

First, create two tables (DEPT and EMP) and associate them with a foreign key constraint.

create table emp(emp_id number primary key, dept_id number);

create table dept(dept_id number primary key);

alter table emp add constraint emp_fk1 foreign key (dept_id) references dept(dept_id);

Now insert some data.

insert into dept values(10);
insert into dept values(20);
insert into dept values(30);
insert into emp values(1,10);
insert into emp values(2,20);
insert into emp values(3,10);
commit;

Open two terminal sessions. From one, delete one record from the child table (don’t commit).

delete from emp where dept_id = 10;

Now attempt to delete from the parent table some data not impacted by the child table delete.

delete from dept where dept_id = 30;

The delete from the parent table hangs until the child table transaction is committed. Without a regular B-tree index on the foreign key column in the child table, any time you attempt to insert or delete in the child table, it places a table-wide lock on the parent table, which prevents deletes or updates in the parent table until the child table transaction completes.

Now run the prior experiment, except this time additionally create an index on the foreign key column of
the child table.

create index emp_fk1 on emp(dept_id);

You should be able to independently run the prior two delete statements. When you have a B-tree index on
the foreign key columns, if deleting from the child table, Oracle will not excessively lock all rows in the
parent table.”